The AI-native industrial operating layer
From any industrial signal to approved action: one governed, physics-grounded loop.
DataOps, edge, digital twins, agents, work, and field evidence connected around every asset. The AI-native operating layer for industrial operations — not a dashboard, not a CMMS. Edge to cloud, on the systems you already run.
Co-developed with operators and system integrators. Deploys alongside SCADA, historians, GIS, and your existing CMMS/EAM — never a forced rip-and-replace.
Edge ingest
Modbus signal streamed & stored on TwinEdge OS
Twin context
Physics twin + operating envelope applied
Diagnose
Bearing degradation · RUL ~18 days · 0.86 conf
Governed action
Drafted with evidence — routed for approval
Replace pump bearing · Priority High
Live example — from edge signal to a governed action: a work order, an energy fix, a compliance record, or a data product.
Co-developed with operators and system integrators. Deploys alongside SCADA, historians, GIS, and your existing CMMS/EAM — never a forced rip-and-replace.
Fits the stack you already run
Connects to your protocols, historians, SCADA, GIS, and CMMS/EAM — out of the box.
Industrial protocols
Systems of record
Building an integration or running a deployment? Join the TwinEdge integrator & design-partner program.
Partner programModeled impact
What a physics-grounded operating layer is built to deliver.
These are modeled outcomes from TwinEdge's physics-based digital twins and optimization — what the platform is engineered to achieve on representative water and wastewater assets.
up to0%
fewer sanitary sewer overflows
Modeled from wet-well level control and force-main hydraulics.
up to0%
lower energy spend
Designed via pump and VFD efficiency optimization against the pump curve.
0.0×
MTBF improvement
Projected from physics-based degradation modeling and PM optimization.
up to0%
fewer manual inspections
From continuous online condition assessment replacing routine rounds.
Projections from physics-based digital-twin simulation and optimization. Actual results vary by site, asset condition, and operating context.
Measured, not modeled · TwinEdge OS edge benchmark
20,333 readings/s ingested and durably stored — 13% lower latency than Siemens' public 20K reference.
The TwinEdge OS data plane (C / open62541 with Apache IoTDB storage) processed and stored a 20,000-tag OPC UA stream with a perfect store ratio, zero sequence gaps, and zero replay backlog — beating Siemens' published 20K live-value reference.
See the full edge benchmark20,333/s
stored readings
20,000-tag tier, 60-second run, 100 ms publish/sample — 1.000 store ratio.
100 ms
p95 source-to-ingest
Against the Siemens 115 ms public 20K live-value reference.
13.0%
lower latency
15 ms faster than the Siemens public 20K live-value reference.
Zero
gaps or replay backlog
Durable append plus Apache IoTDB acceptance across the full stream.
Competitive local benchmark against Siemens' published IIH 20K live-value reference — not a hardware certification. Production sizing should be validated on your target hardware for throughput, soak duration, and power-loss recovery.
See it on your assets
Request a demo tailored to your operation.
Tell us your industry and what you run today. We'll show you the live operating layer on assets like yours — physics twins, failure diagnosis, governed recommendations, and the auto-drafted work order — and how it deploys alongside your existing systems.
- Walkthrough on your asset class and protocols
- No rip-and-replace — layered on your CMMS/EAM, SCADA, and GIS
- Or download TwinEdge for a no-cloud technical evaluation
We'll follow up within 1 business day.
GIS-aware operations
Operational GIS connects assets, telemetry, work, inspections, compliance zones, field routes, risk, and capital plans.
Edge-to-cloud execution
TwinEdge OS provides local protocol access, storage, inference, dashboards, alerts, and store-forward resilience.
Learning recommendations
Approvals, rejected suggestions, closeout notes, failures, inspections, and operator feedback improve future physics-informed recommendations.
Physics and science foundation
TwinEdge is built around physics-based asset and process understanding.
Industrial teams do not need another dashboard or generic AI layer. TwinEdge grounds recommendations in asset physics, process behavior, operating envelopes, failure modes, and field evidence so engineers can trust why the platform recommends action.
Physics-based asset twins
Equipment twins use first-principles models, performance curves, operating envelopes, sensor mappings, and correction factors to understand real asset behavior.
Process-level digital twins
Asset models compose into process twins so teams can understand how a pump, valve, blower, chiller, line, or unit operation affects the whole system.
Failure analysis and diagnosis
TwinEdge connects symptoms to likely failure modes, affected sensors, source evidence, operating context, and recommended maintenance action.
Predictive maintenance grounded in science
Physics-informed predictions combine degradation, condition, operating load, historical failures, O&M guidance, and machine learning feedback.
Why traditional maintenance breaks
CMMS/EAM records the work. TwinEdge understands the live asset.
Traditional asset management breaks down when the record, the asset, the map, the manual, the field crew, and the operating data are separated. TwinEdge connects them in one operating layer without forcing a rip-and-replace.
Static asset register
Traditional pattern
Asset records, manuals, GIS layers, telemetry, and work history drift apart.
TwinEdge approach
TwinEdge creates a physics-based digital twin for each asset with signals, documents, spatial context, work, parts, risk, failure modes, and evidence.
Calendar-first PM
Traditional pattern
Preventive maintenance is scheduled by interval even when condition, load, physics, alarms, and operating risk say otherwise.
TwinEdge approach
TwinEdge recommends and optimizes PM work using operating envelopes, physics-based degradation, condition, O&M guidance, failure patterns, crew windows, and parts readiness.
Reactive work triage
Traditional pattern
Dispatch depends on manual judgment, spreadsheet reconciliation, and tribal knowledge.
TwinEdge approach
Agents explain physics-based risk, failure mode, process impact, urgency, routes, source evidence, and recommended action while keeping humans in approval control.
No learning loop
Traditional pattern
A completed work order rarely improves the next recommendation.
TwinEdge approach
TwinEdge learns from approvals, rejections, closeout notes, inspections, failures, and operator feedback so physics-informed recommendations improve over time.
Agentic Analytics Platform
Industrial DataOps plus governed agents, analytics, and operational action.
TwinEdge gives enterprise teams the industrial DataOps foundation they expect: connect sources, model operational context, build governed data products, and expose REST/MCP interfaces. The difference is that TwinEdge carries physics-based twin context into recommendations, PM optimization, work orders, GIS-aware response, field evidence, and learning loops.
Platform depth
7
packaged agents
Showcased governed agents for industrial operations.
10
agent skills
Reusable skills for draft, validate, explain, diff, test, replay, and approval workflows.
REST/MCP
AI-ready products
Governed interfaces for approved apps, agents, copilots, and enterprise systems.
Industrial DataOps foundation
Connect sources, browse tags, model assets, build pipelines, manage namespace and graph context, and monitor readiness.
Governed data products
Publish trusted operational context through cataloged REST and MCP products for BI, copilots, agents, and enterprise apps.
Packaged industrial agents
Run bounded agents for monitoring, diagnostics, planning, capital, inventory, compliance, and knowledge workflows.
Action and learning loop
Move approved recommendations into schedules, work orders, field tasks, evidence, and feedback that improves future runs.
Platform proof
See the live operating layer across physics insights, assets, GIS, recommendations, edge, water, capital planning, and sustainability.
TwinEdge gives enterprise teams one connected path from source readiness and physics-based asset context to AssetOps EAM, O&M intelligence, spatial operations, TwinEdge OS, WaterOS, planning workflows, and ESG evidence.
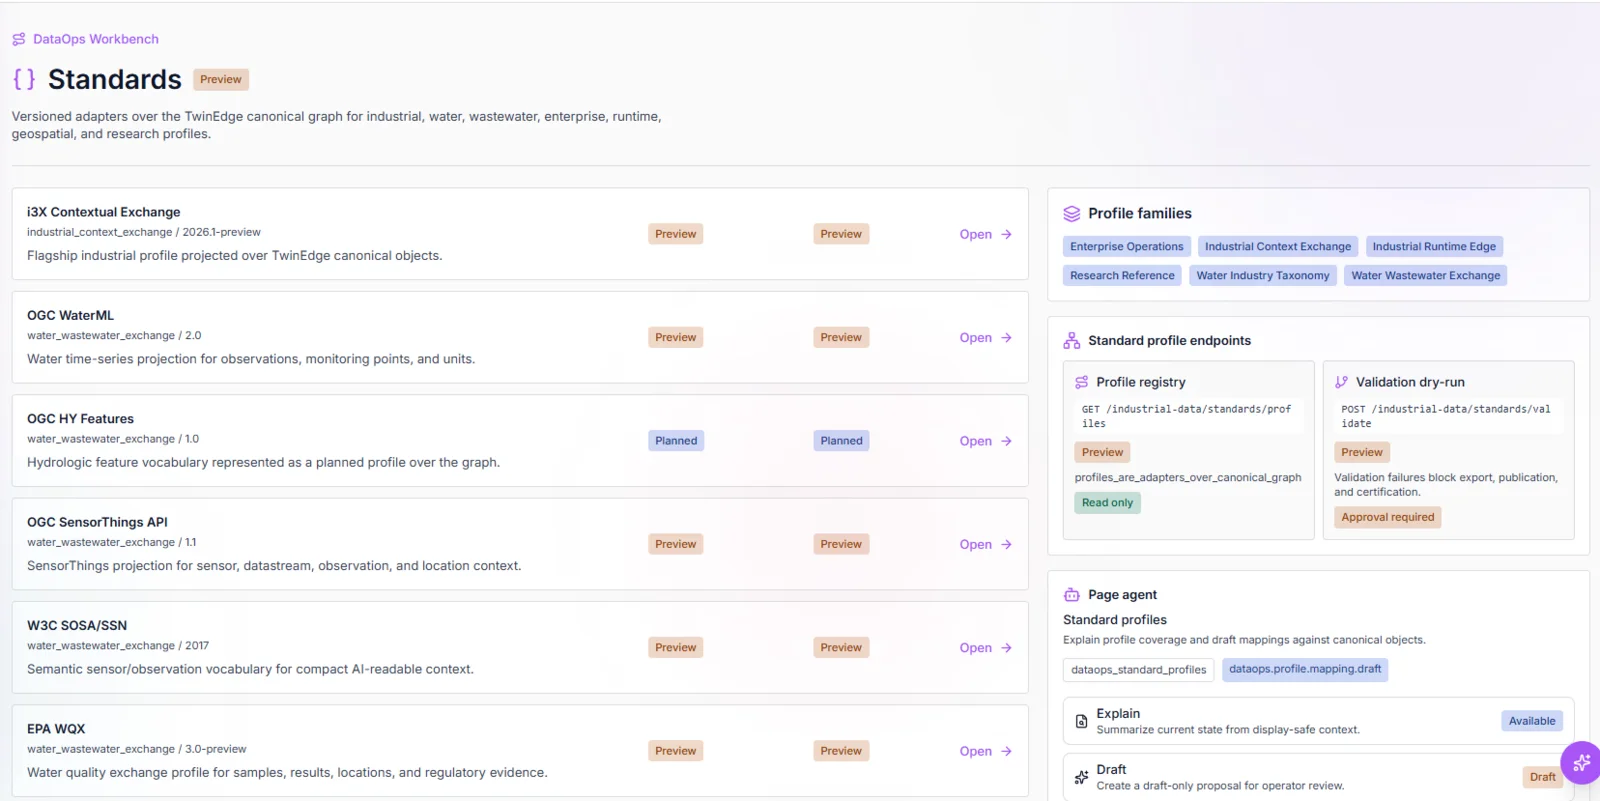
Standards and profile registry
i3X, WaterML, SensorThings, SOSA/SSN, WQX, and other profiles sit over the TwinEdge canonical graph with visible maturity states.
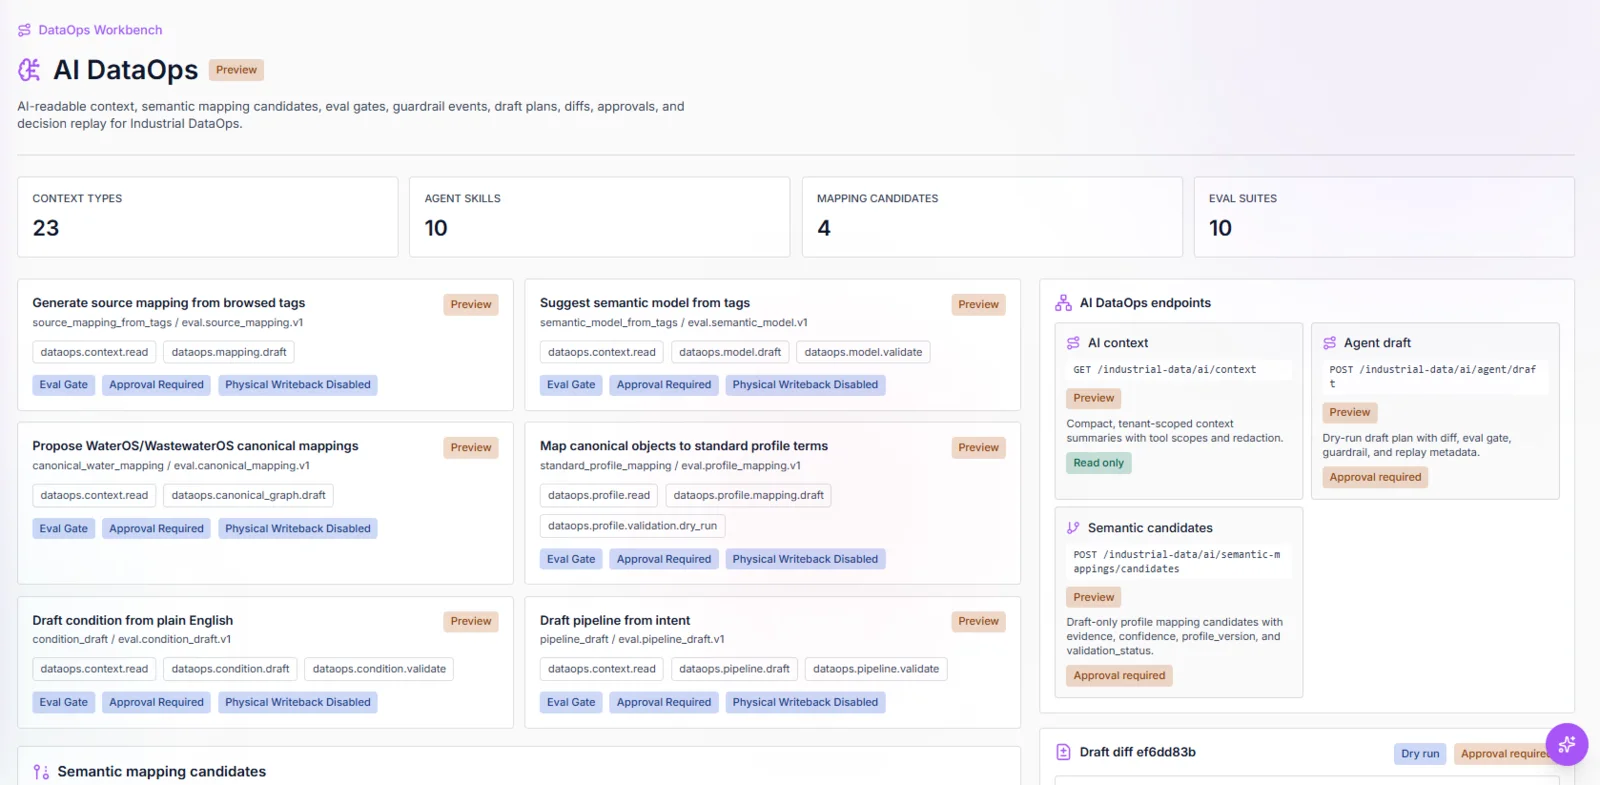
AI DataOps workspace
Bounded AI workspace over source metadata, asset bindings, graph context, standards, and approved operational products.
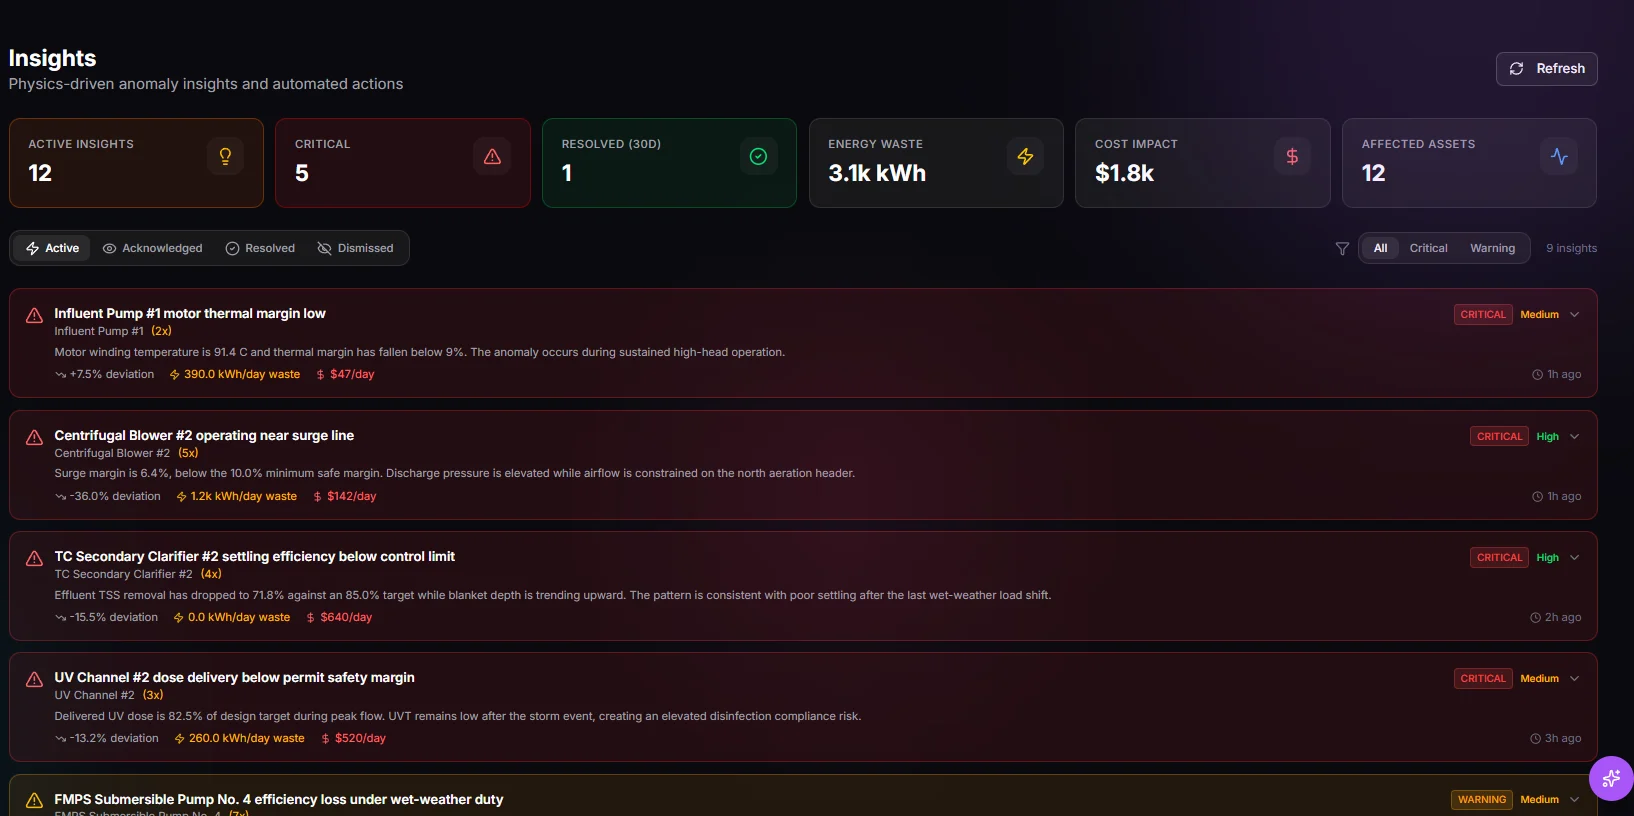
Physics-driven asset insights
Physics-based anomaly context, energy waste, cost impact, affected assets, and action-ready recommendations in one review surface.
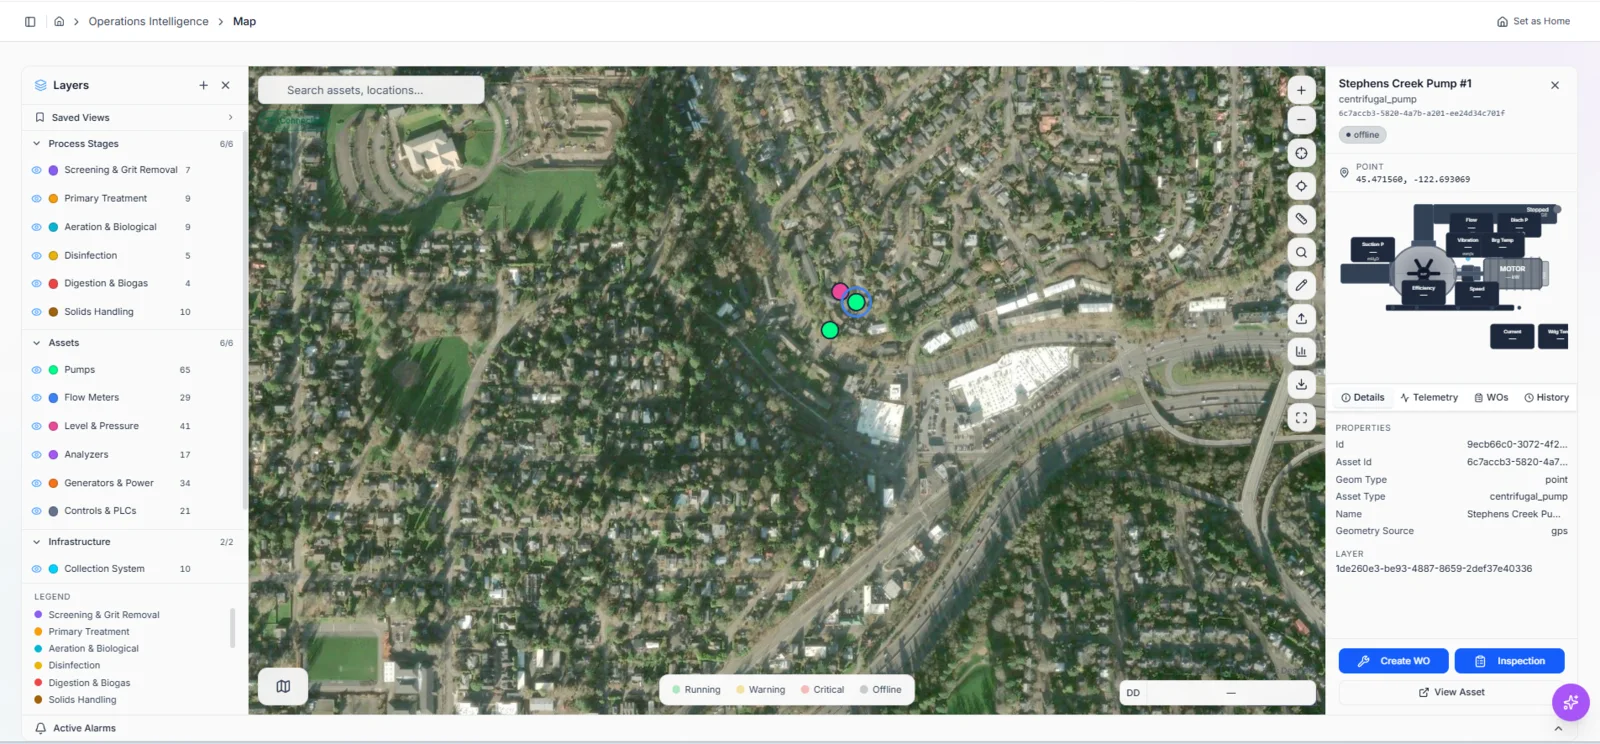
GIS + asset digital twin
Operational map with layer controls, asset selection, work action, inspection action, telemetry, and digital twin context.
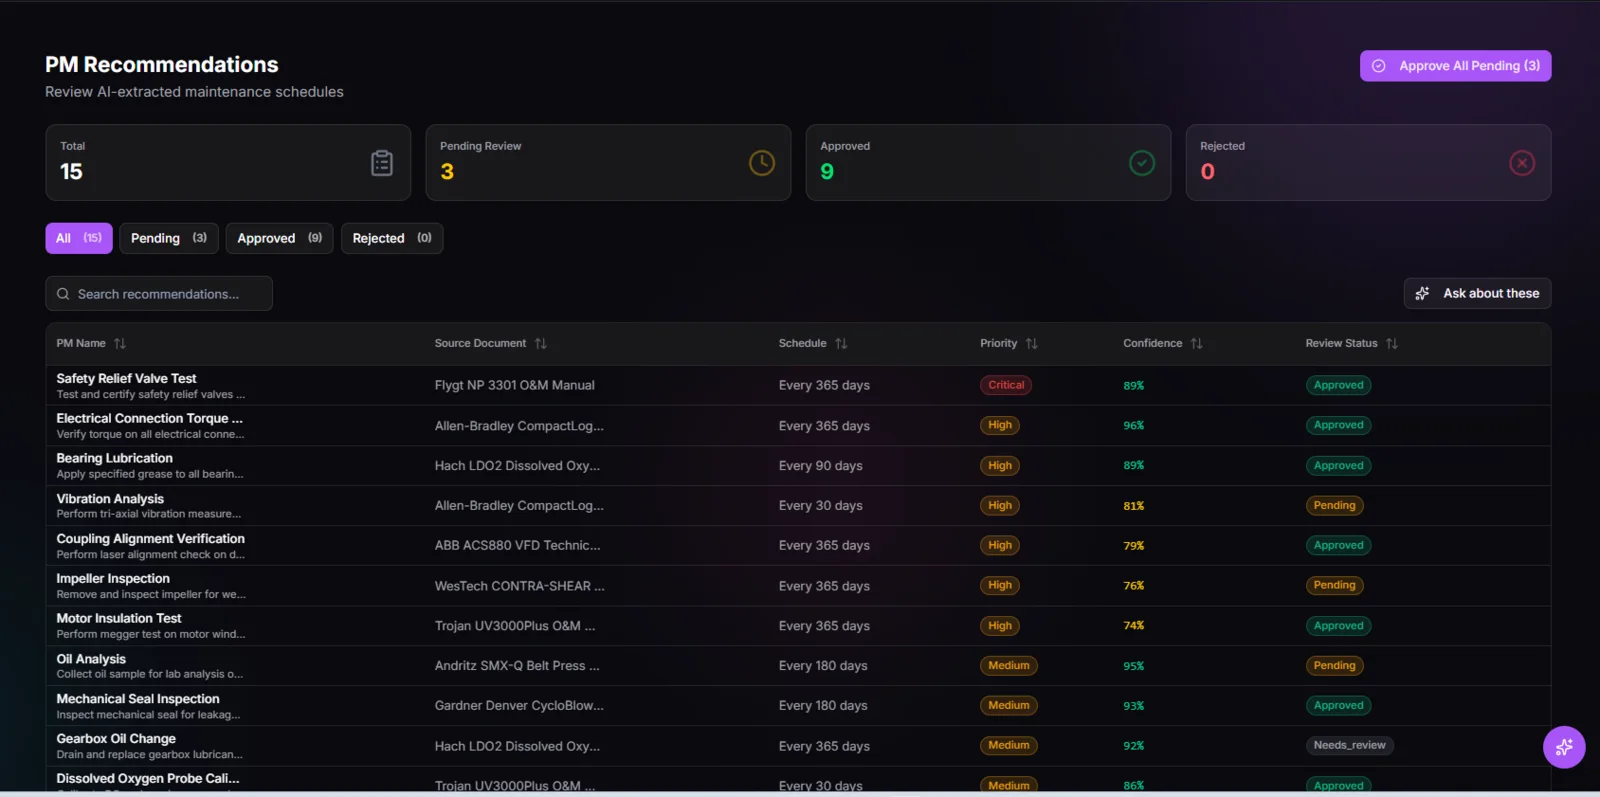
AI PM recommendations
O&M-derived preventive maintenance recommendations with confidence, source documents, priority, and approval state.
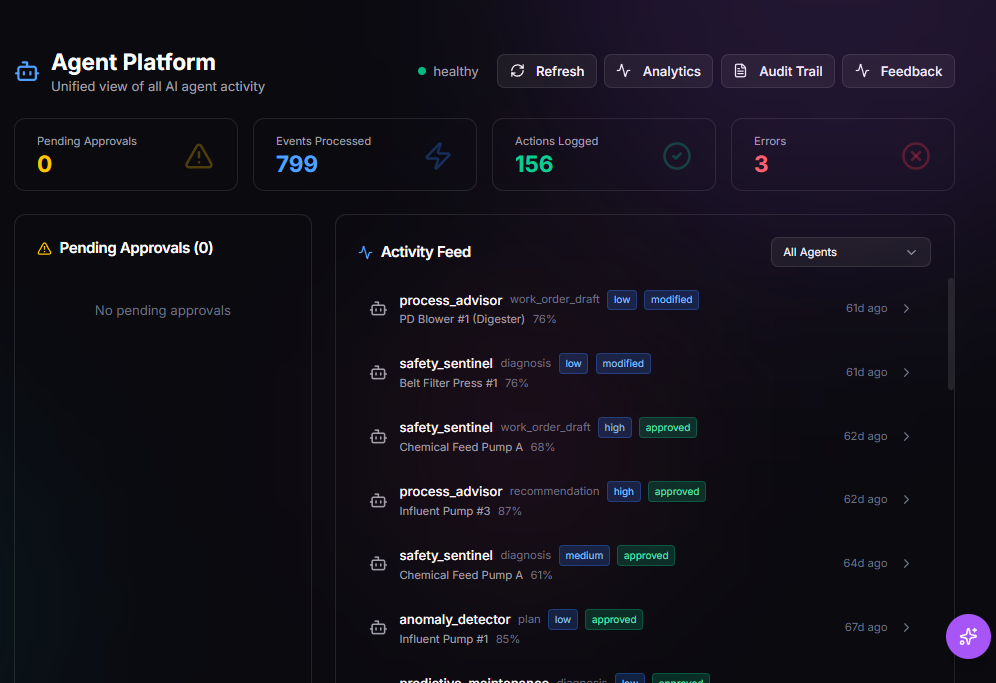
Agent Hub and governed agents
Agent Hub shows live activity, approvals, and impact across packaged industrial agents.
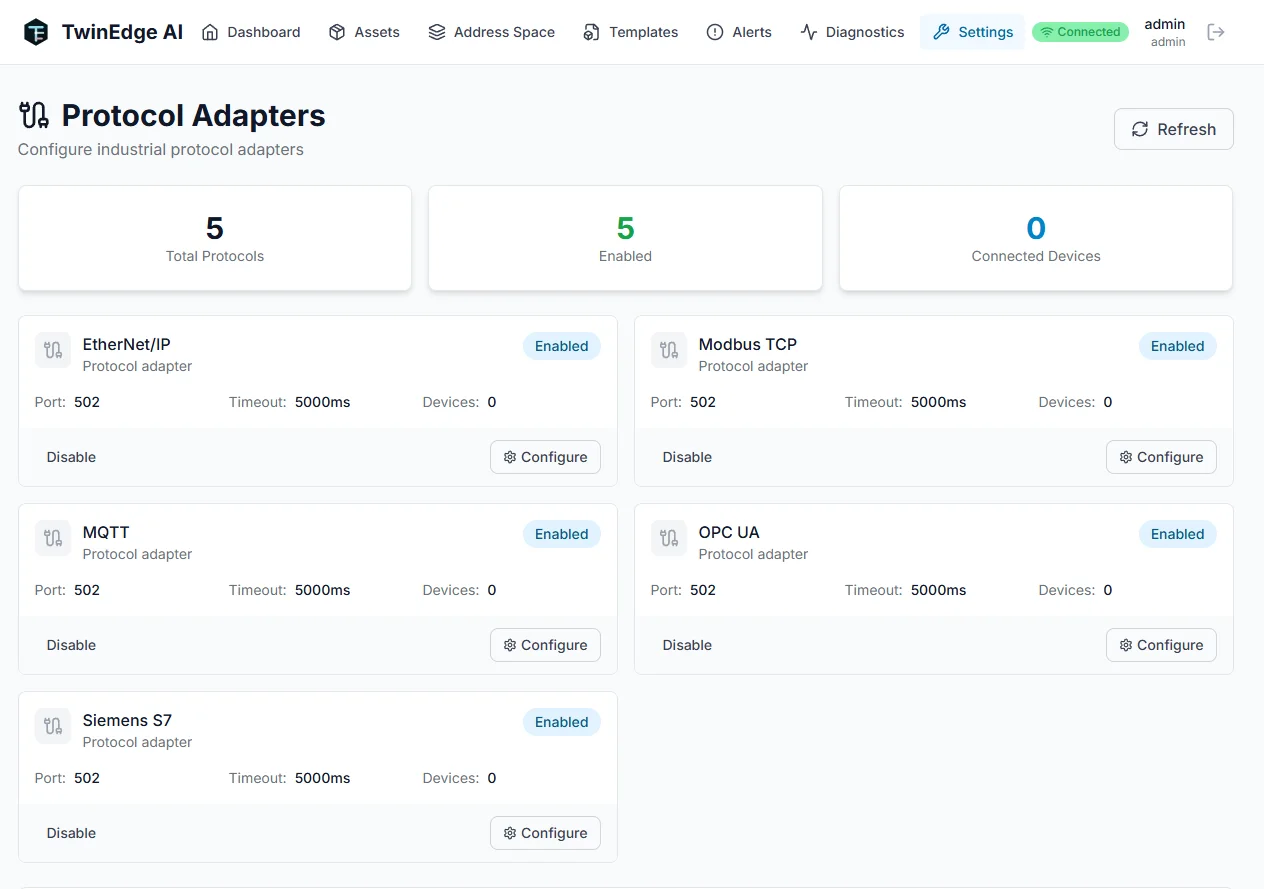
TwinEdge OS protocol adapters
Local protocol access, edge configuration, and no-cloud evaluation paths are visible in the TwinEdge OS admin console.
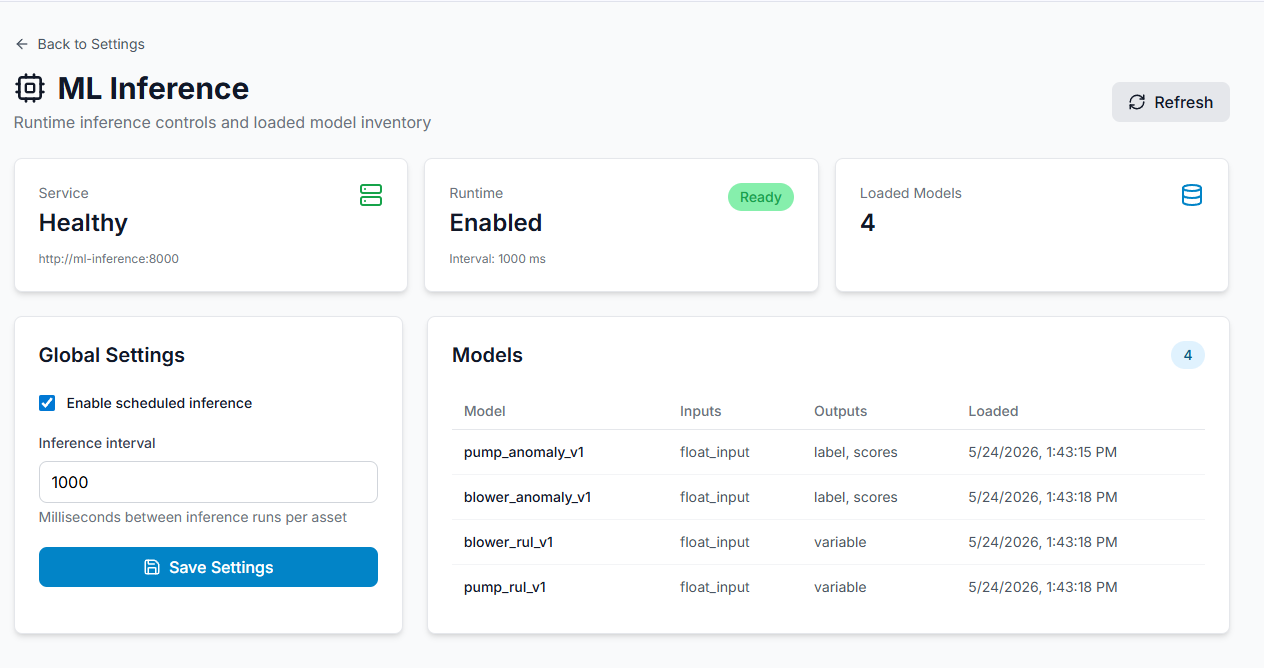
TwinEdge OS ML inference
Runtime inference controls, loaded model inventory, and health state show how local models run close to industrial assets.
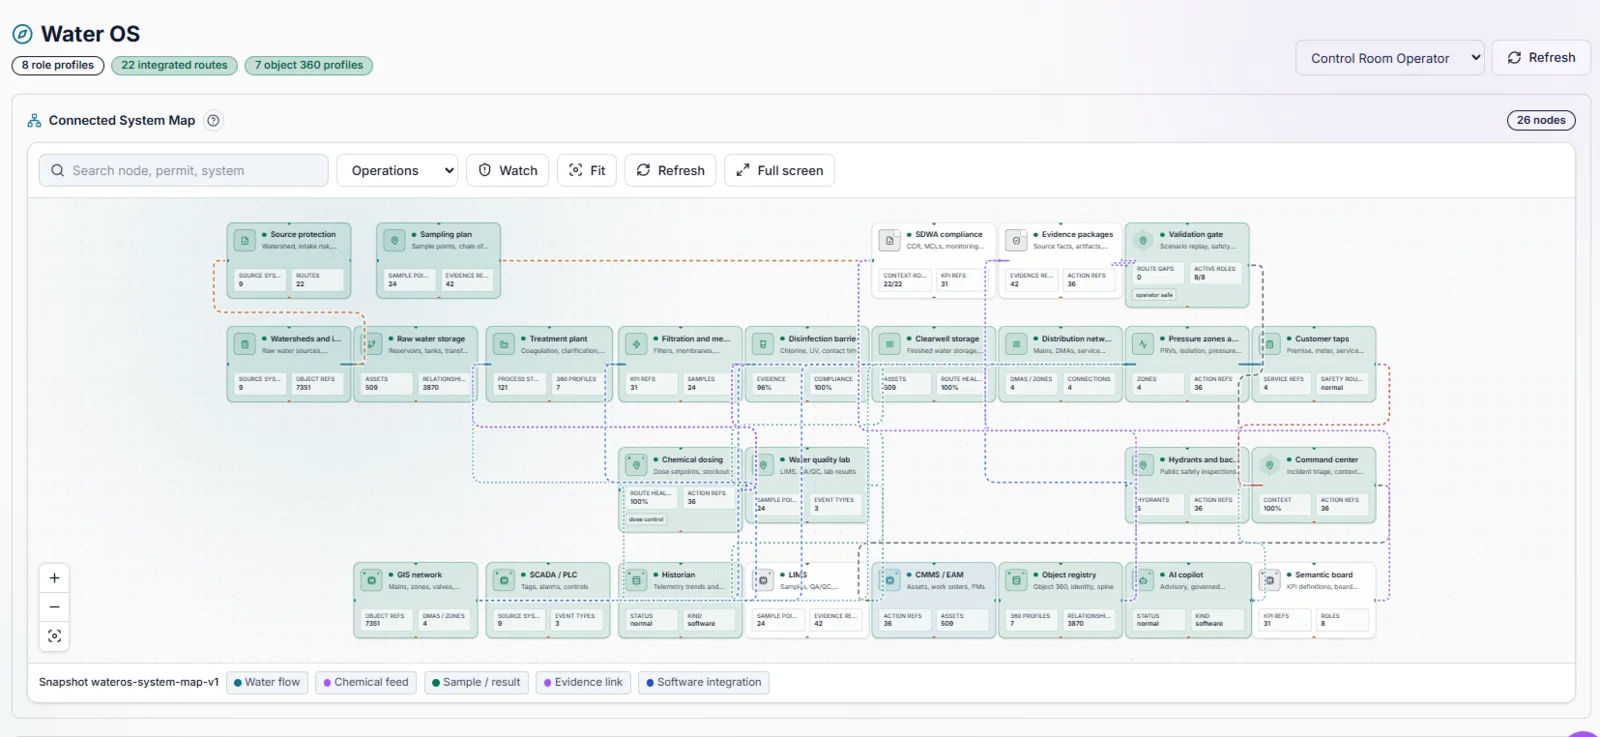
WaterOS connected system map
Water operations are modeled as connected systems: treatment, storage, pressure zones, compliance, GIS, SCADA, LIMS, CMMS, and AI copilots.
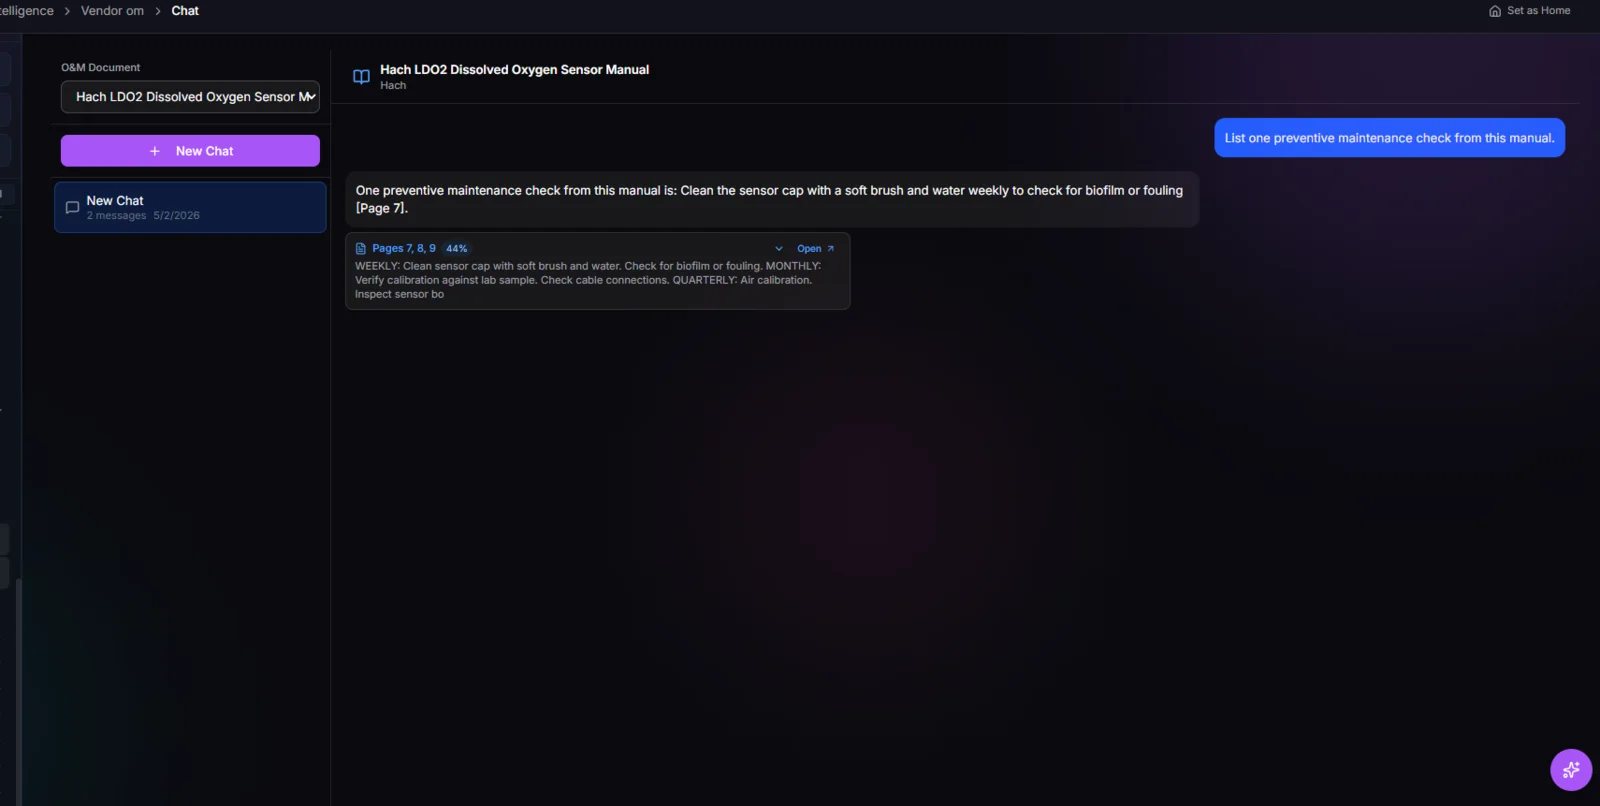
AssetOps O&M chat with citations
Technicians and planners can ask manual questions and get cited answers with page references before turning knowledge into work.
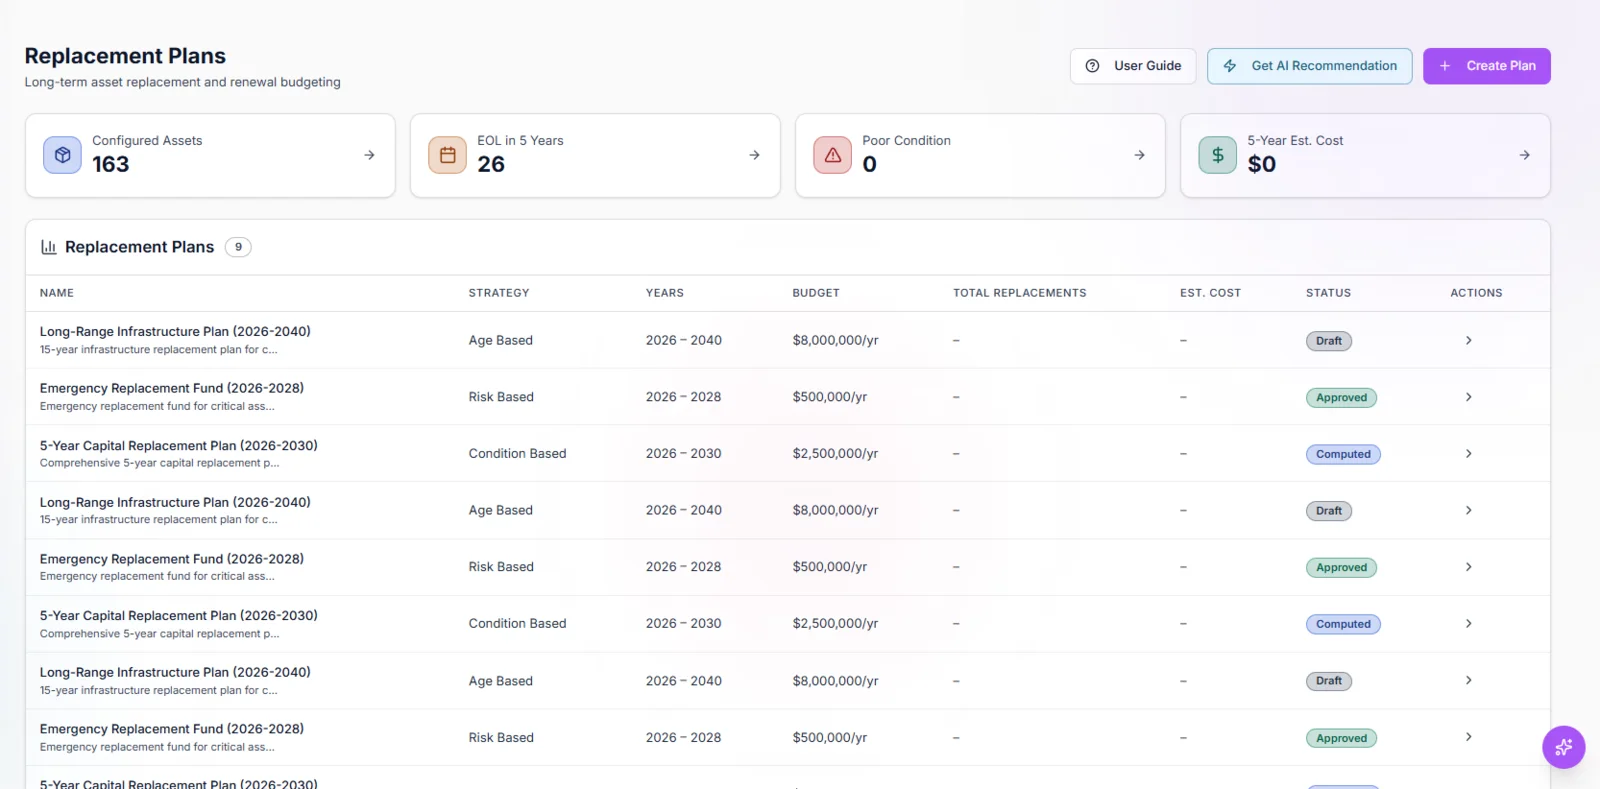
Capital replacement planning
Asset risk, replacement plans, lifecycle cost, capital timing, and portfolio evidence connect to long-range operating strategy.
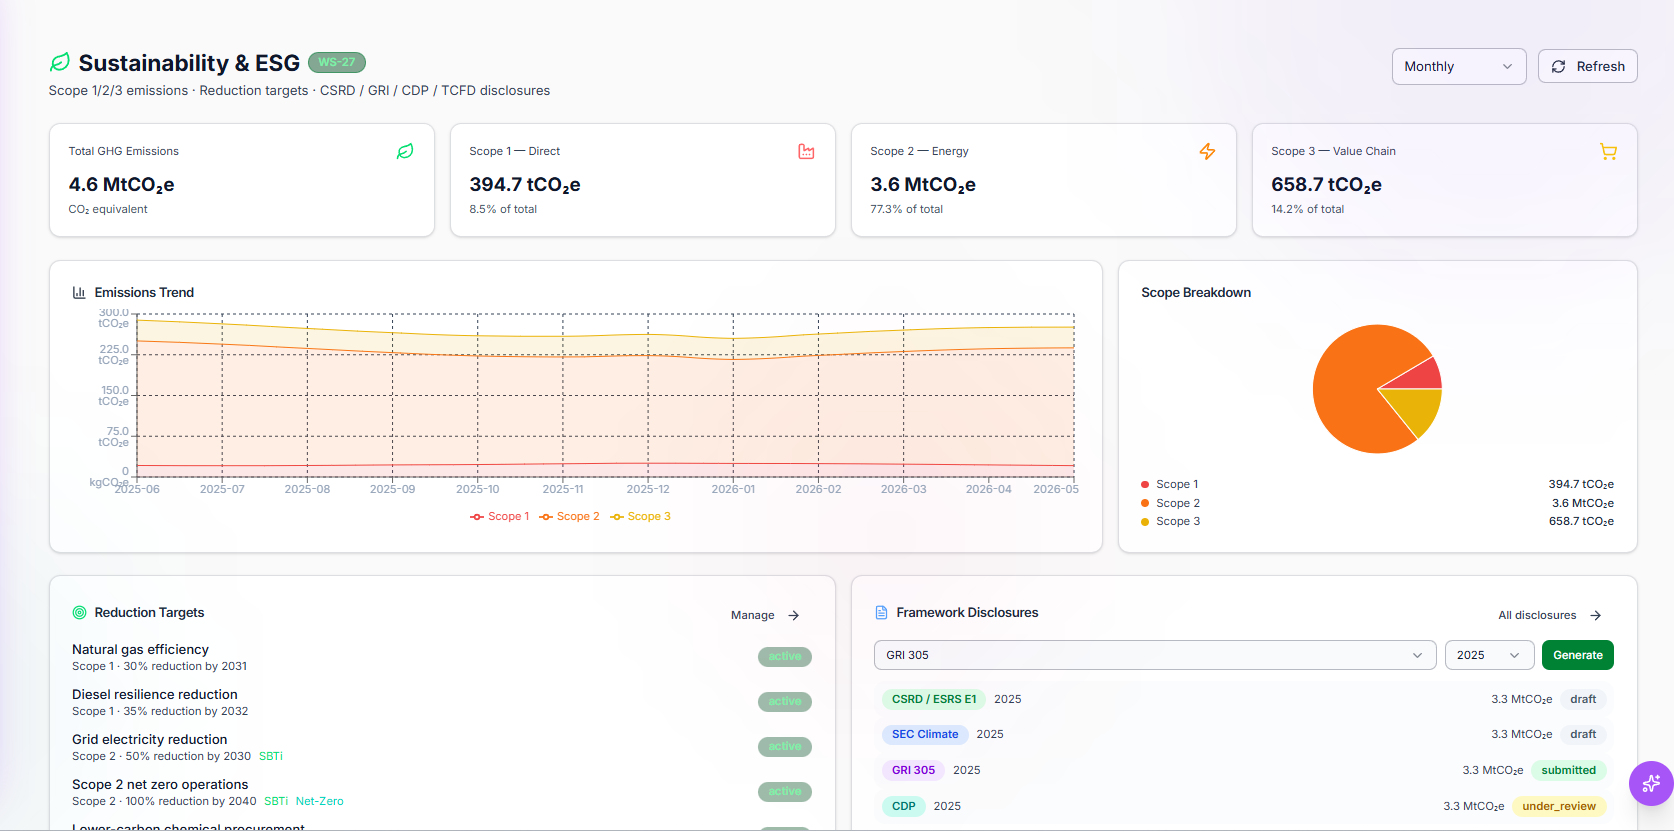
Sustainability and ESG
Scope emissions, reduction targets, disclosure workflows, and framework evidence stay tied to operational activity.
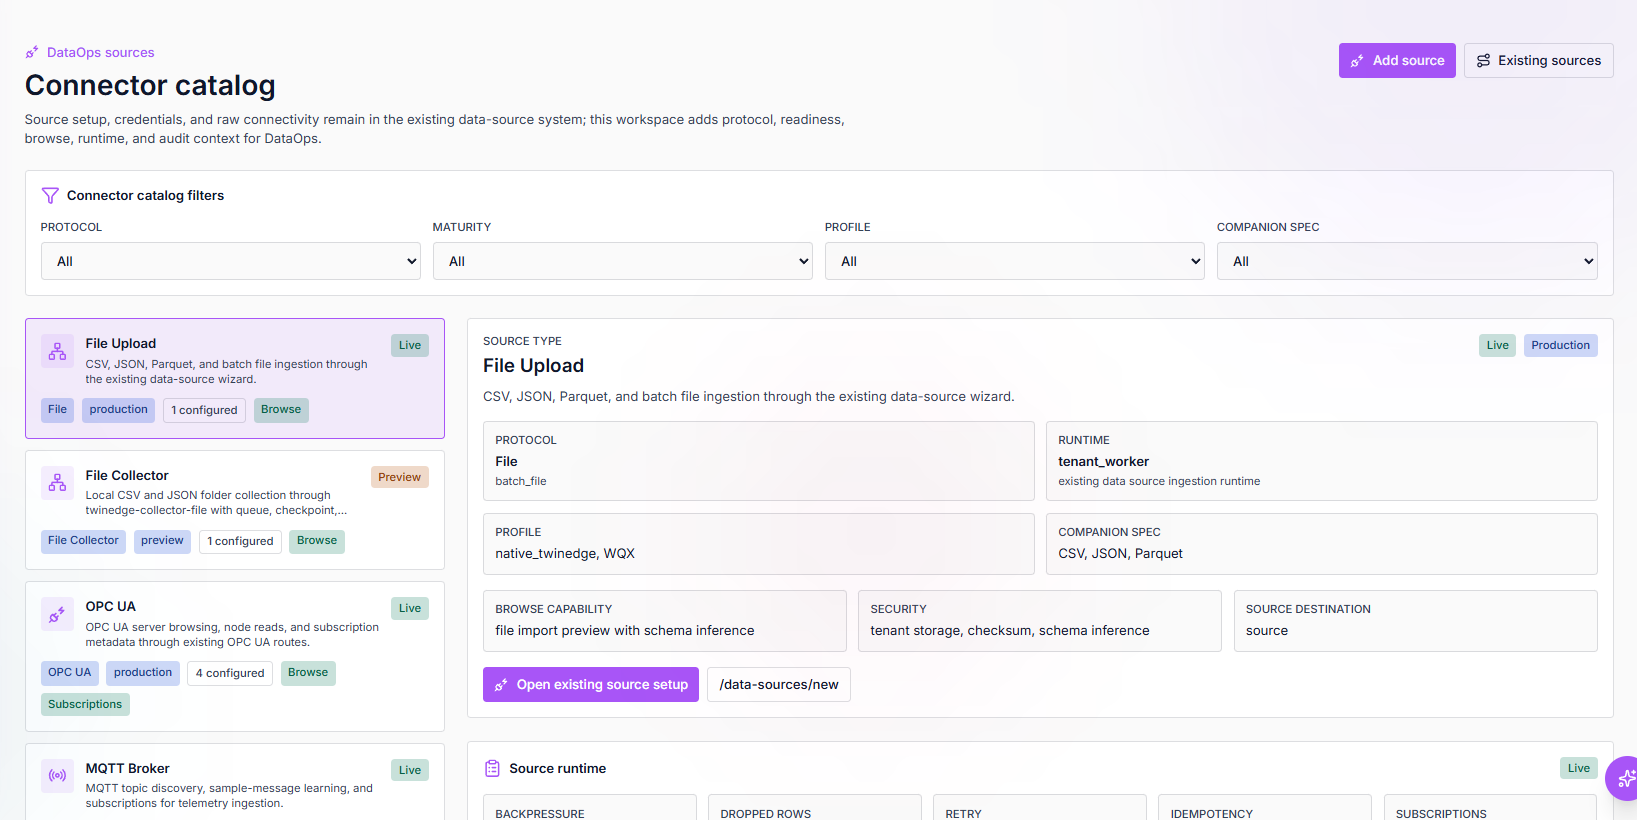
DataOps connector catalog
Source setup, credentials, polling details, runtime state, and connector health make industrial data onboarding visible.
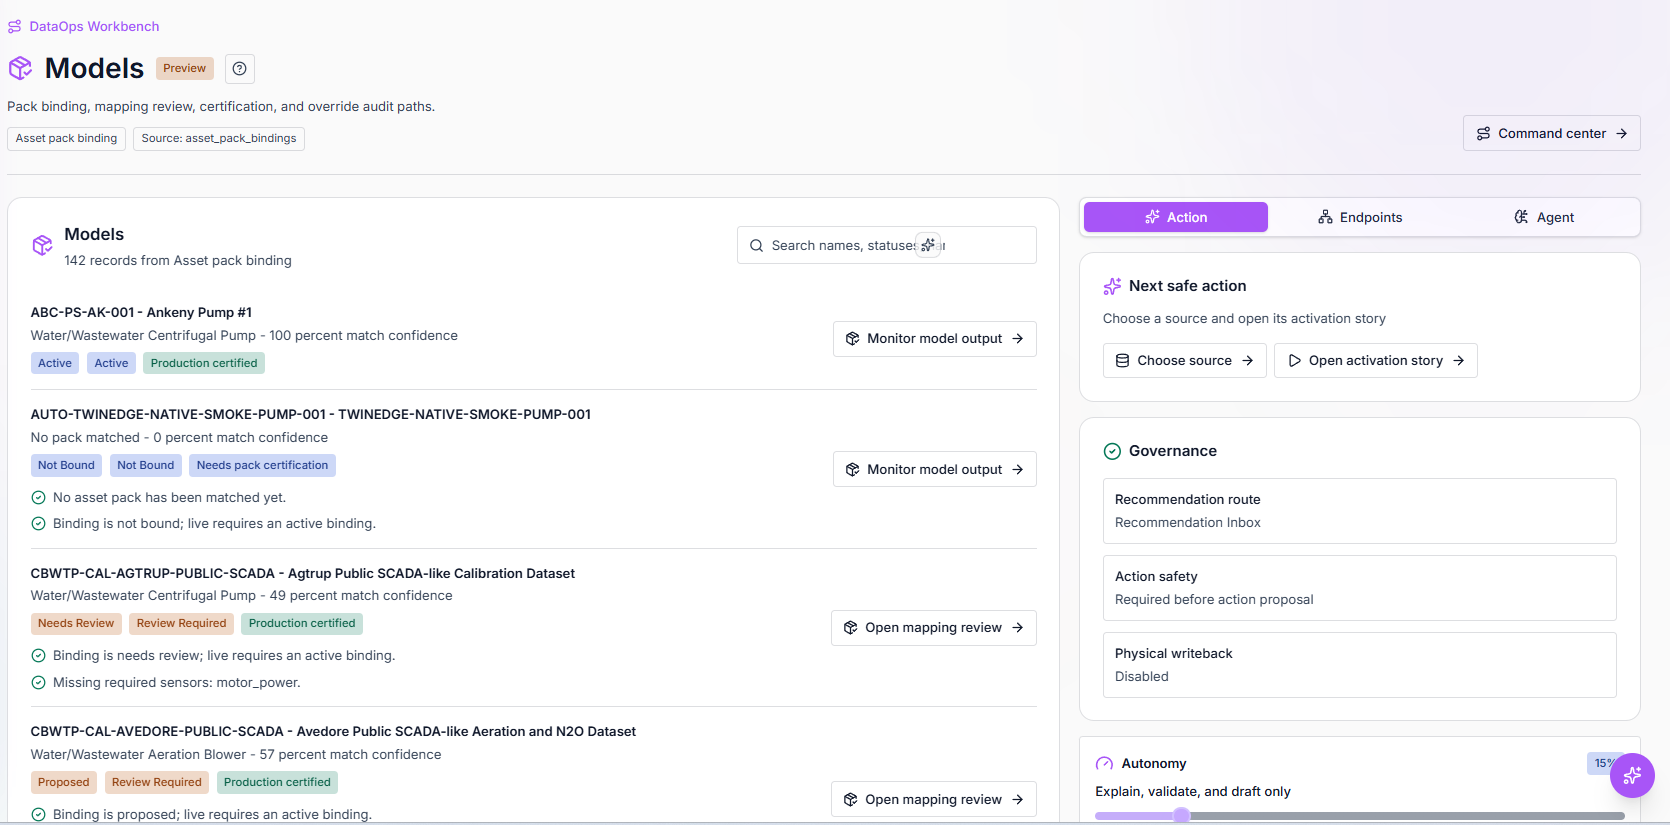
DataOps asset model mapping
Asset bindings, source tags, models, mapping review, and publishing actions turn raw signals into governed operating context.
One layer vs four point tools
Each incumbent owns one layer. TwinEdge connects all of them.
DataOps, the edge runtime, EAM, and field mobile are sold as separate platforms — then stitched together with integration projects that never quite close the loop. TwinEdge ships them as one governed operating layer, so a single connected loop replaces four to five point tools.
DataOps & UNS
Typically a standalone platform — e.g. HighByte
Edge runtime
Typically a standalone platform — e.g. Siemens IIH
EAM & work
Typically a standalone platform — e.g. IBM Maximo
Field mobile
Typically a standalone platform — e.g. ServiceNow
TwinEdge unifies all four into one physics-grounded operating layer — connect, model, diagnose, act, and learn without seams between products.
<50%
software cost position
Typical commercial position vs comparable established-platform software scope.
~½
implementation services
About half the established-platform implementation effort for similar scope.
~½
deployment timeline
About half the implementation timeline for comparable established-platform scope.
Commercial position versus comparable established-platform scope; actual outcome varies by modules, services, data migration, and ecosystem. Comparisons reference public competitor materials.
Old way vs TwinEdge
Move from static records to live, AI-native operations.
TwinEdge is designed for industrial teams that already have systems of record. It adds the connected operating layer those systems were never built to provide.
Old way
CMMS/EAM is treated as a static system of record.
TwinEdge way
TwinEdge makes AssetOps EAM a live system of action connected to sensors, digital twins, GIS, documents, field evidence, and enterprise systems.
Teams manage the actual operating asset, not a stale record about the asset.
Old way
Maintenance planning is driven by calendar PMs, manual triage, and tribal knowledge.
TwinEdge way
TwinEdge combines condition, physics-based digital twin behavior, failure history, O&M/EOM knowledge, parts, crew windows, GIS routes, and risk to recommend better work.
Maintenance moves from ticket tracking to reliability-centered execution, predictive maintenance, and optimized scheduling.
Old way
Generic AI chat answers questions but does not close the operational loop.
TwinEdge way
Governed agents explain, draft, optimize, validate, route approvals, execute handoffs, preserve replay, and learn from outcomes.
Leaders get AI speed without losing control, auditability, or engineering trust.
Operating model
The operating loop is connect, model, diagnose, predict, optimize, execute, and learn.
TwinEdge connects existing source systems, creates physics-based asset and process twin context, diagnoses failure risk, predicts maintenance needs, optimizes schedules, routes approvals, and turns field outcomes into better future recommendations.
Connect
Model
Diagnose
Predict
Optimize
Execute
Learn
DataOps Workbench
Build the asset and process context agents can trust.
DataOps Workbench connects sources, maps tags to real assets and physics model inputs, validates quality, builds canonical context, and publishes governed REST and MCP products so recommendations are grounded in operational truth.
Sources and tag browser
Models, instances, and pipelines
Canonical graph and namespace
AI workspace, APIs/MCP, catalog, and monitor
Agentic industrial OS
Specialized agents operate inside the asset management loop.
TwinEdge agents are purpose-built for industrial operations. They reason over physics models, operating envelopes, failure modes, O&M knowledge, live telemetry, and approved enterprise context before drafting recommendations, optimizing PM schedules, validating readiness, and preserving replayable evidence.
Recommendation agent
Turns telemetry, physics model outputs, alarms, manuals, O&M/EOM knowledge, and asset history into evidence-backed recommendations.
PM scheduling optimizer
Balances physics-based condition, failure risk, crew availability, parts, permits, downtime windows, GIS routes, and service commitments.
O&M guidance agent
Answers technician and planner questions with cited procedures before converting knowledge into approved work.
Spatial operations agent
Connects work to assets, routes, zones, compliance boundaries, hazards, field inspections, and capital risk.
Inventory and readiness agent
Checks parts, spares, reorder risk, task prerequisites, and execution readiness before work reaches the field.
Capital and compliance agent
Rolls asset risk, replacement timing, evidence, regulatory obligations, and executive reporting into the same operating layer.
Learning recommendation system
Every maintenance outcome improves the next physics-informed recommendation.
TwinEdge closes the loop traditional maintenance systems miss. The recommendation system uses machine learning, physics model outputs, and operator feedback to improve ranking, timing, schedule fit, failure-mode confidence, and evidence quality as teams use the platform.
Signals that improve the model
Recommendation approved, edited, deferred, or rejected
Actual failure mode and root-cause notes
Technician closeout evidence and inspection findings
Part usage, stockouts, and reorder timing
Runtime, energy, alarm, and condition changes after work
Planner feedback on schedule quality and crew fit
Product family
A modular product family that expands into an agentic industrial OS.
TwinEdge is not just a dashboard, edge box, historian add-on, CMMS, or AI copilot. It connects industrial DataOps, governed agents, physics-based digital twins, TwinEdge OS, AssetOps EAM, Field, and industry operating systems around the same live operating context.
Connect
Collector Core, OT Bridge, and TwinEdge OS connect local and cloud data paths.
Context
DataOps Workbench, canonical graph, digital twins, standards, and operating envelopes.
Intelligence
Agentic Analytics, governed recommendations, PM scheduling optimization, API/MCP products, traces, and replay.
Execution
AssetOps EAM and Field turn recommendations into work orders, safety, inspections, technician evidence, and completion.
Industry operations
Water OS, Wastewater OS, Chemical OS, Water Loss OS, Lab, Facility OS, and Water Quality/Regulatory.
Planning and sustainability
Capital Planning and Sustainability/ESG connect asset strategy, funding, emissions, targets, and disclosures.
Why TwinEdge is different
TwinEdge connects the systems that manage work with the physics of the assets doing the work.
TwinEdge is the operating layer between existing enterprise systems and real asset behavior: physics-based twins, process context, spatial context, governed agents, optimized maintenance, field execution, and continuous learning in one adoption path.
Canonical graph first, standards as governed projections.
Physics-based asset twins connect telemetry, operating envelopes, failure modes, and engineering constraints.
Process twins show how asset behavior propagates across the facility, network, line, or treatment train.
GIS is operational context for assets, work, field routes, risk, compliance, and capital plans.
The recommendation system improves with approvals, rejections, closeout notes, failures, inspections, and operator feedback.
Adopt without rip and replace
Start with one source, one asset class, and one governed recommendation workflow.
TwinEdge works alongside SCADA, historians, MQTT, GIS, CMMS/EAM, LIMS, ERP, dashboards, and data lakes. Cloud connector, Collector, OT Bridge, and TwinEdge OS give customers the right deployment path for each site.
Industry proof
Lead with water and wastewater. Expand across industrial operations.
Pump Station Twin is the flagship entry point because it is concrete: telemetry, pump behavior, GIS context, energy, maintenance risk, PM optimization, field response, and evidence-backed recommendations.
Pump Station Twin
Lift Station Twin
Treatment Plant Twin
Water Quality and Regulatory
Capital Planning
Sustainability and ESG
Starter packages
Evaluate TwinEdge
See one static asset record become a live twin, a diagnosis, and an approved work order.
Request a demo for strategic fit, or download TwinEdge for a no-cloud technical evaluation of the operating layer.